
Does it seem like your Mac is running slowly? It’s always possible that you need more RAM, a speedy SSD to replace a slow hard drive, or even a new Mac. But you might just have a rogue app that’s hogging your Mac’s CPU. Here’s how to figure out if that’s the problem.
The key is a utility app called Activity Monitor that Apple bundles with every Mac. Open your Applications folder and scroll down until you see the Utilities folder. Open that to find and double-click Activity Monitor.
Activity Monitor can seem daunting because it lists every “process” running on your Mac. In many cases, a process is the same as what you think of as an app, so you’ll see processes for apps like Mail and Safari. However, some apps use multiple processes, and macOS itself relies on a ton of processes too.
Notice the buttons at the top of Activity Monitor that provide access to different views: CPU, Memory, Energy, Disk, and Network. Those views show the impact each process has on those aspects of the Mac. For now, we’ll focus on the CPU view that’s the default, but if you were trying to figure out why your MacBook Pro’s battery was draining so quickly, you’d look in the Energy view.
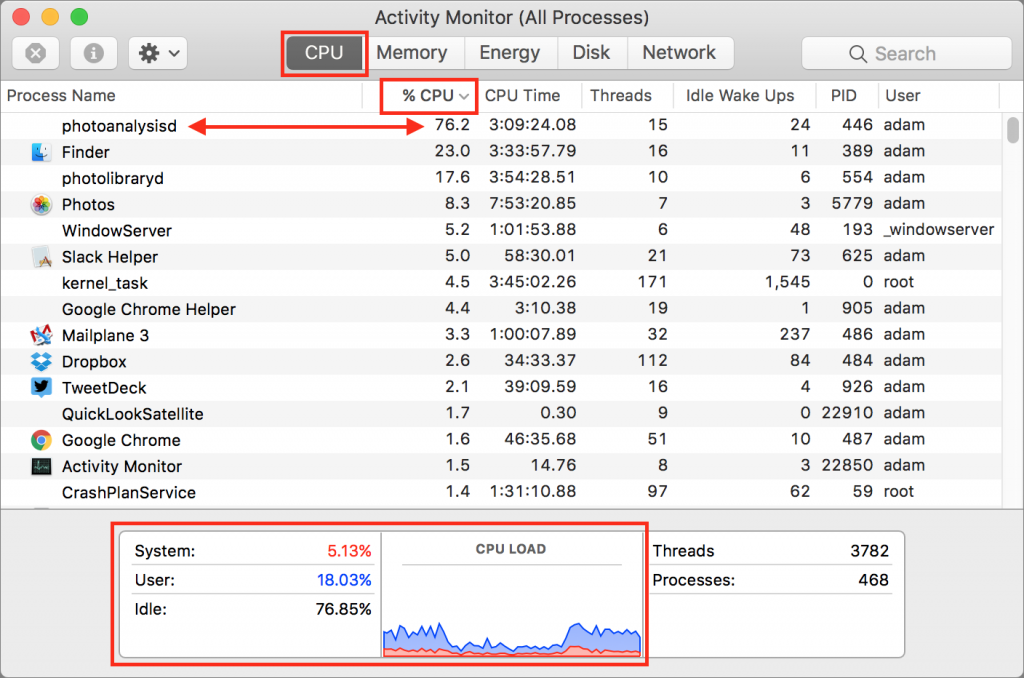
At the bottom of the CPU view is a graph of CPU load, and numbers that correspond to how much of that load comes from the system and how much from the user (apps you’ve launched). As long as the sum of those numbers stays under 100% most of the time, you’re probably fine. But if you’re near or at 100%, you’ll want to hunt for rogue processes.
To identify them, click the % CPU column header to sort the process list by CPU power. If necessary, click again to change the direction of the sort so the arrow next to % CPU is pointing down, so those processes using the most CPU power are at the top. Be aware that the percentages in this column are by core (unlike the graph and numbers at the bottom), so a runaway app on a 4-core iMac could claim to be using as much as 400% in the % CPU column.
Now watch the list for a while. If one process is sucking CPU power, you’ll see it at the top of the list. If it matches an app you’ve launched, quit that app to give other apps a chance at the CPU. That often solves your problem quickly. In the most extreme case, the process name will be in red, which means it’s not responding, at which point you can force quit it by selecting it and then clicking the X button at the left of Activity Monitor’s toolbar.
Equally likely, though, is that the top process will be one you don’t recognize immediately, like backupd (Time Machine), mds or mdworker (Spotlight), photolibraryd or photoanalysisd (Photos), or kernel_task or WindowServer (core macOS functionality). You can’t (or at least shouldn’t) quit those processes manually, but at least you’ll know that things are slow due to a Time Machine backup running, Spotlight indexing new files, or Photos analyzing the images in your library. If one of these processes has gone nuts, the best solution is to restart your Mac.
If you can’t identify a single rogue app, or if the slowdown doesn’t seem to be related to any app, you can learn more about how to resolve performance problems in the ebook Speeding Up Your Mac: A Joe On Tech Guide. Or, of course, get in touch, and we’ll see if we can suggest software fixes or new hardware that will help.
Twitter: If your Mac seems slow, click over to our site for a quick tutorial on identifying rogue apps with Activity Monitor:
Facebook: Slow Mac? This article can help you identify the culprit.